- Our analysis of satellite imagery recorded sharp vegetation loss across 4,452 hectares in nine areas of South Lebanon between March 2025 and August 2026, measured against a September 2024 baseline.
- In Shamaa, Majdal Zoun and Tayr Debba, sharp loss reached 71.6% of the area we analysed; in Yaroun, Ainata, Rmeish, Srifa and Hanine, vegetation degradation reached 66.5%.
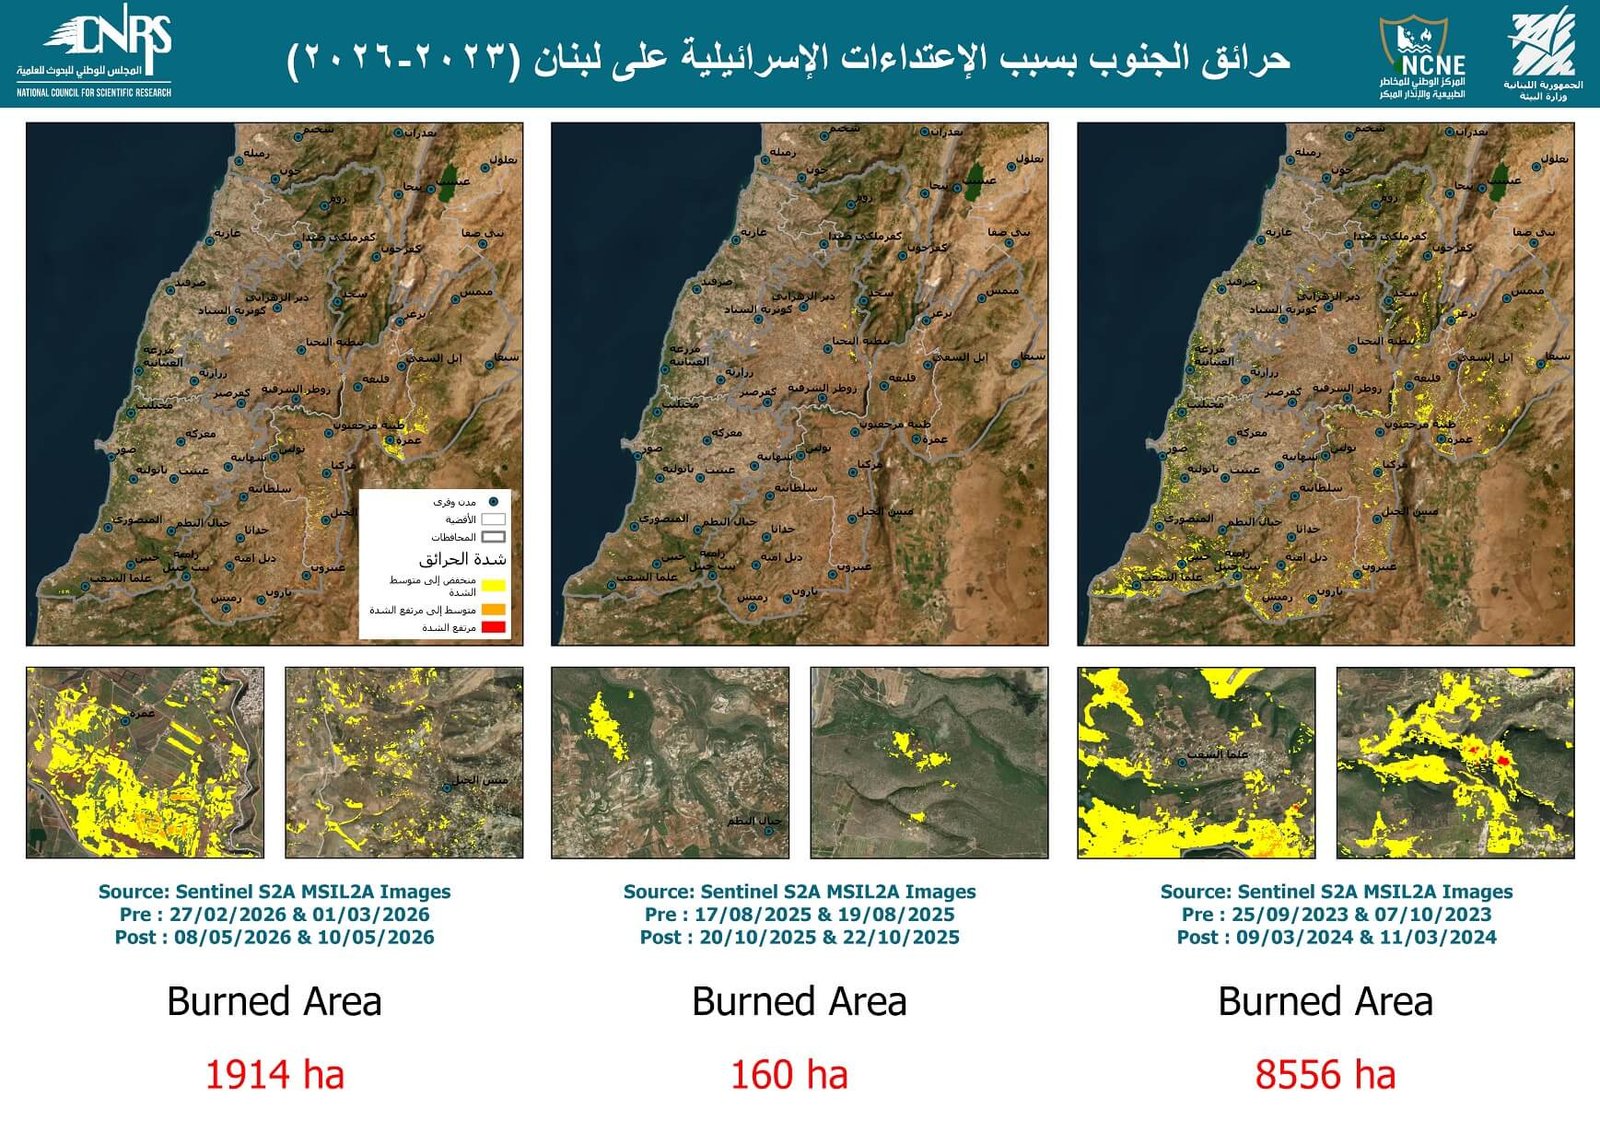
- According to Lebanon’s National Council for Scientific Research (CNRS), about 8,556 hectares burned in the first five months of the war, 160 hectares during the period of ceasefire violations, and more than 1,914 hectares since the war resumed in March 2026.
- After aerial spraying over border areas in February 2026, which Lebanese ministries attributed to Israeli military aircraft, the Ministry of Environment and CNRS detected glyphosate in every sample. They estimated the affected area at about 2,122 hectares across ten villages.
- Farmland in the South and Nabatieh governorates shrank by about 30% between 2019 and 2025, and Bint Jbeil district lost roughly two-thirds of its farmland since 2021.
- Across the districts we analysed, the dominant pattern is agricultural rather than forest loss: in five of seven districts, farmland declined by more than tree cover, by a wide margin in Bint Jbeil (−66.0%) and Nabatieh (−48.5%). Likely factors include the glyphosate spraying over farmland in ten villages, the displacement of residents by military operations (more than 1.3 million people by November 2024, per the World Bank), which left fields untended, and the roughly $247 million in olive losses estimated by FAO and the Ministry of Agriculture. District-level figures are less precise than governorate-level ones.
- The Ministry of Environment put the cost of the environmental damage at more than $440 million, and the Food and Agriculture Organization (FAO) and the Ministry of Agriculture estimated olive losses alone at about $247 million.
Three years of war
When hostilities broke out on the Lebanese southern front in October 2023, then escalated into a ground invasion and intensive bombardment in late 2024, continuing with violations into 2026, the front lines were not the only arena of attack. Rather, its effects extended to civilian infrastructure, the environment, and farmland.
- 8 October 2023Hostilities begin on the southern border after the war in Gaza breaks out.
- 1 October 2024Israeli ground invasion of South Lebanon begins.
- 27 November 2024A ceasefire takes effect, followed by a period of continuing violations.
- 2 March 2026The war resumes after US-Israeli strikes on Iran.
- 16 March 2026New Israeli ground operations begin in the South.
According to the Ministry of Public Health, about 8,953 people had been killed and 30,649 wounded as of 25 September 2026, with roughly half of the deaths since 2 March 2026 alone. More than 1.3 million people were displaced as of November 2024, according to the damage and loss assessment prepared by the World Bank. Amid this disaster, the environment and vegetation of the South became a target.
Widespread environmental degradation
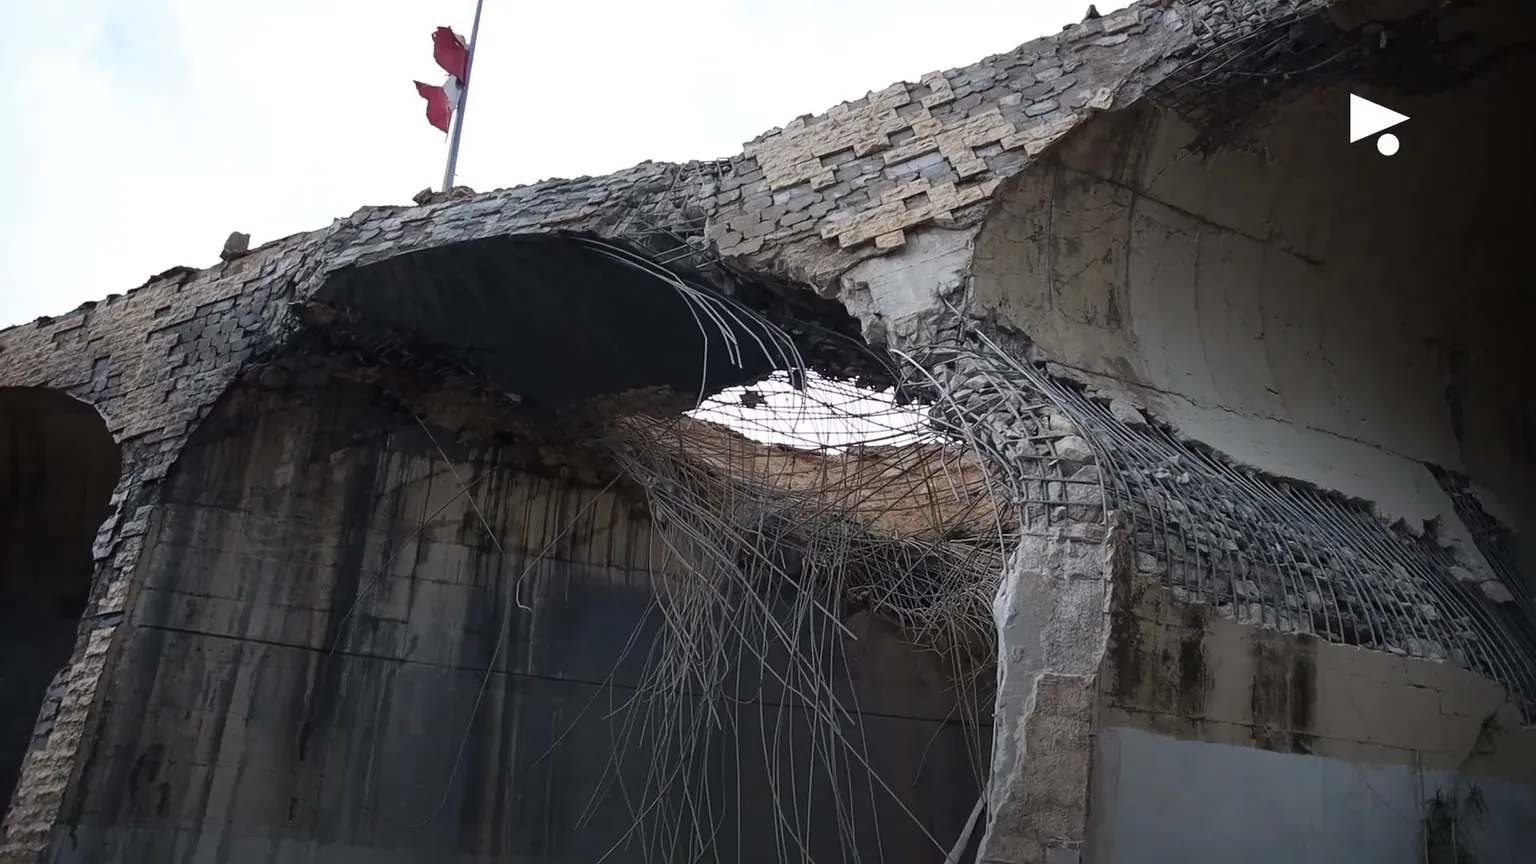
Between 2023 and 2026, the border strip suffered widespread environmental degradation. Fires hit historic forests, farm orchards and residential areas, amidst a backdrop of systematic bulldozing and uprooting of old-growth trees and green spaces.
According to the National Council for Scientific Research, the burned area was about 8,556 hectares in the first five months of the war, roughly 160 hectares during the period of violations between 2024 and 2026, and more than 1,914 hectares since the March 2026 war began.
Fires are not new to Lebanon, but they now reach an unprecedented level. According to an academic study published in the journal Fire on fire trends between 2001 and 2020, about 2,044 hectares burn on average each year, or 0.58% of the land cover. But the number of fires jumped from about 200 in 2022 to 6,412 in 2024 alone, according to the Nawa Media dashboard.
Between October 2023 and December 2024, 814 hectares of olive orchards and 637 hectares of citrus burned, and nearly 5,000 hectares of forest and tree cover were damaged. This includes 4,787 hectares of broadleaf trees, 89 hectares of stone pine and 70 hectares of other pine species, according to the Post-War Recovery Report issued by the National Council for Scientific Research.
The World Bank, in its assessment published in November 2024, put damage to the environment sector at about $221 million and losses at about $214 million, and noted that 13% of forests and 16% of rangelands were affected.
What satellite imagery shows
To check these figures on the ground, we obtained high-resolution satellite imagery from the SkySat (half a metre resolution) and PlanetScope (three metre resolution) platforms, and analysed 18 scenes covering nine areas of South Lebanon between March 2025 and August 2026. We compared the vegetation in each against a September 2024 baseline, taken days before the ground invasion.
We used the VARI index, a vegetation index calculated from the three visible colours in an image, which rises as vegetation becomes greener. We then subtracted the index value in September 2024 from its value in each later scene. Where the value falls by more than 0.1, we classify the pixel as sharp loss. Full details are in the methodology section below, and the distribution of the four classes for each frame is in Technical Appendix I.
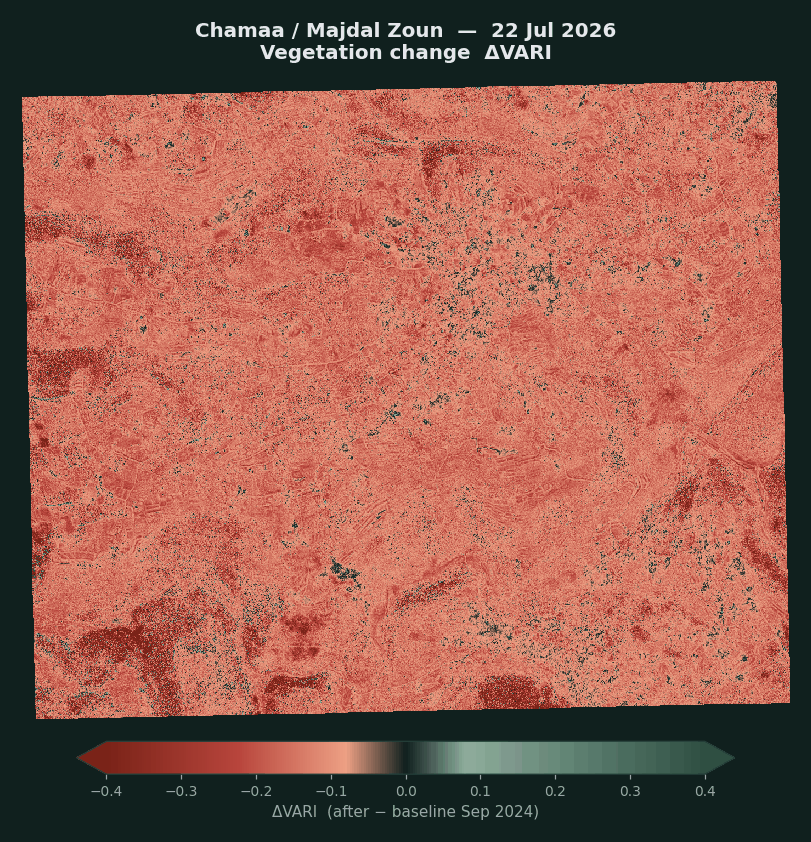
The analysis recorded sharp vegetation loss across 4,452 hectares. The loss is concentrated in two frames along the border strip. In Shamaa, Majdal Zoun and Tayr Debba, villages located in the Tyre district, sharp loss reached 71.6% of the area we analysed in the 22 July 2026 scene. In Yaroun, Ainata, Rmeish, Srifa and Hanine, in Bint Jbeil district, it reached 66.5% in the 17 June 2026 scene. In Dhayra and Mansouri it was 51.6%.
By contrast, areas farther from the border, such as Ghazieh, Sarafand and Nabatieh al-Tahta, recorded sharp loss of no more than 6% of their area, which is consistent with the distribution of fires and attacks along the border strip on the National Council for Scientific Research map.
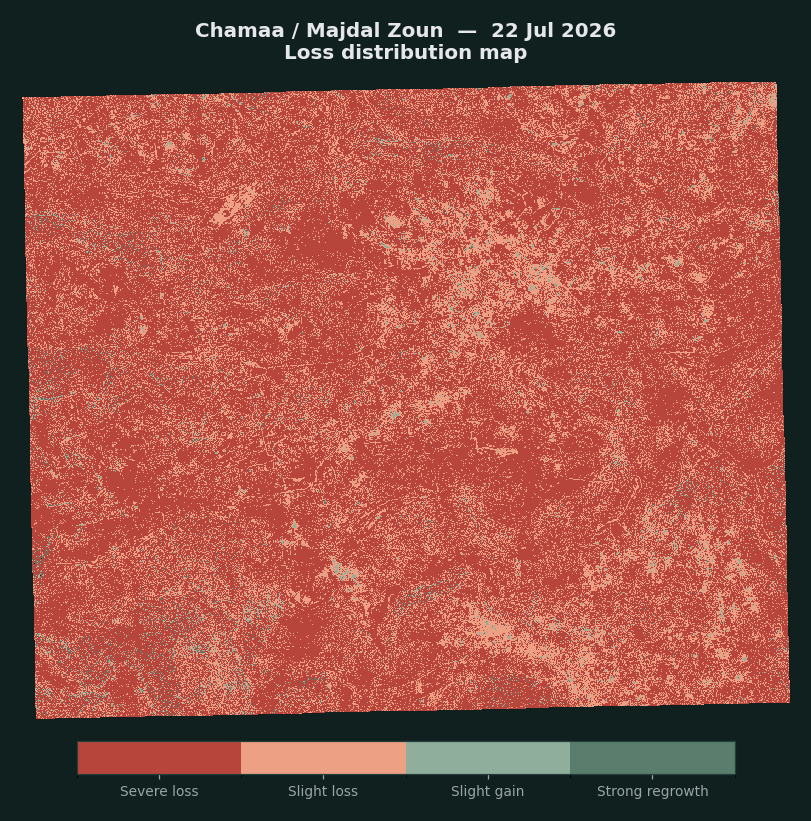
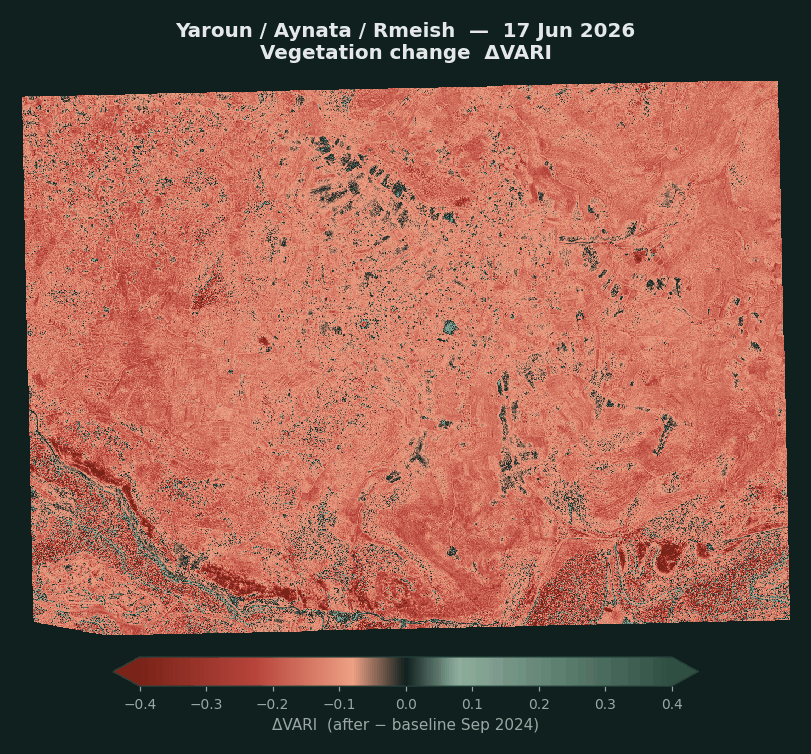
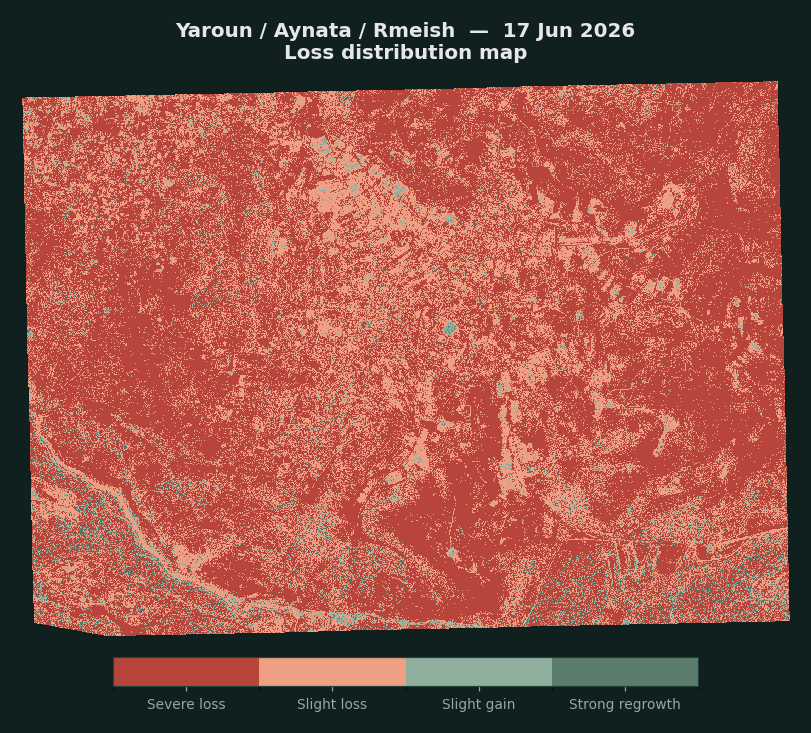
| Area | Scene date | Area analysed (ha) | Sharp loss (ha) | Share |
|---|---|---|---|---|
| Shamaa · Majdal Zoun · Tayr Debba | 22 July 2026 | 1,716 | 1,228 | 71.6% |
| Yaroun · Ainata · Rmeish · Srifa · Hanine | 17 June 2026 | 2,673 | 1,779 | 66.5% |
| Dhayra · Mansouri | 3 June 2026 | 714 | 368 | 51.6% |
| Ainata · Yaroun · Blida · Aitaroun | 17 March 2026 | 1,912 | 462 | 24.2% |
| Kfarchouba · Khirbet Selm · Debaal Baseline: 24 September 2024 | 17 July 2026 | 5,042 | 290 | 5.8% |
| Sarafand · Zrariyeh · Kfarsir | 23 May 2026 | 1,792 | 105 | 5.8% |
| Ghazieh · Bourj Rahhal | 4 March 2025 | 1,288 | 58 | 4.5% |
| Tebnine · Deir Mimas | 28 March 2026 | 1,721 | 57 | 3.3% |
| Nabatieh al-Tahta · Arnoun | 7 May 2026 | 674 | 13 | 1.9% |
Percentages are calculated for each scene separately. The 4,452-hectare total is calculated after merging the scenes onto a single grid and counting each pixel once, because some frames were captured on two dates and some overlap with others. The total therefore does not equal the sum of the rows.
A third of farmland in six years
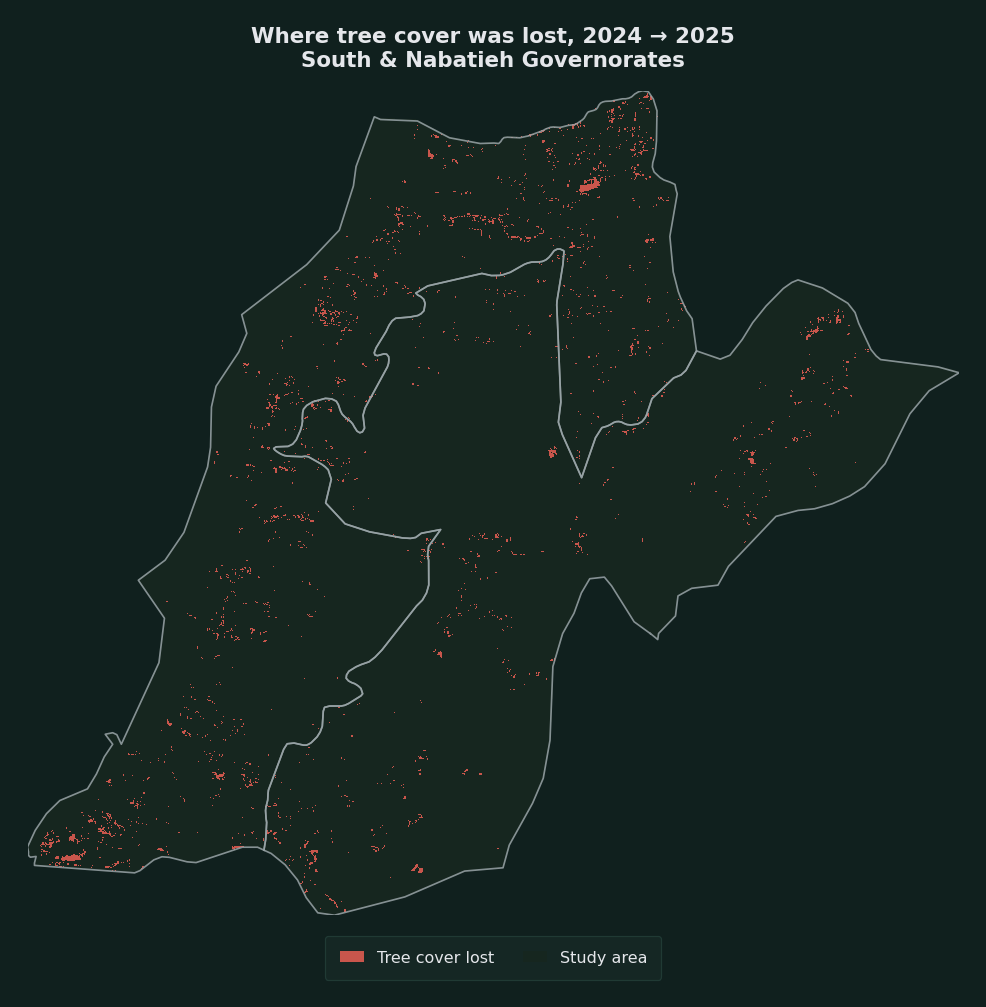
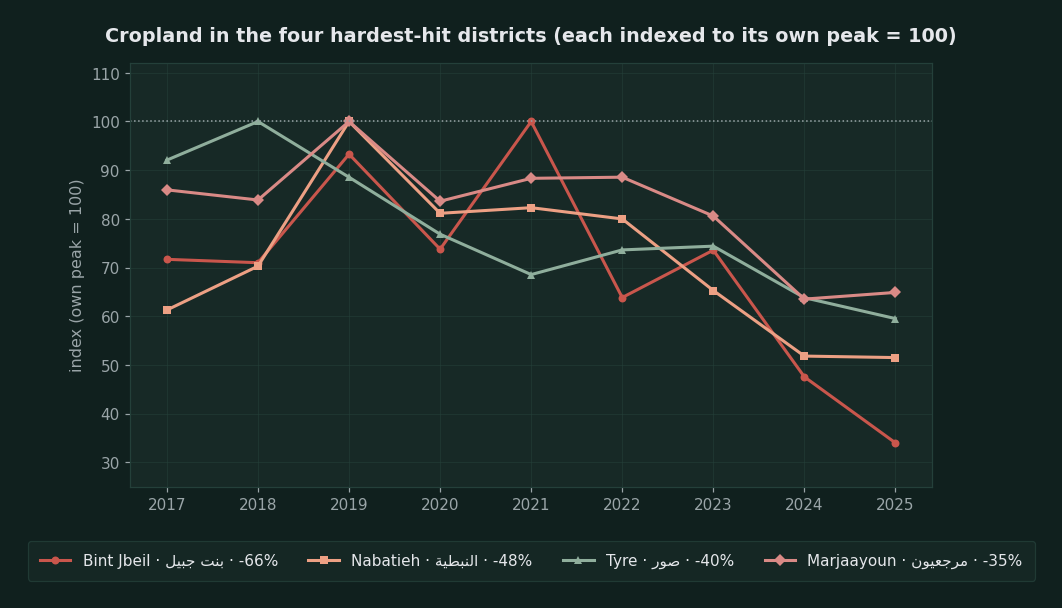
To measure change over a longer period, we also analysed free Sentinel‑2 imagery at ten-metre resolution for the South and Nabatieh governorates between 2017 and 2025. The results show that farmland shrank by about 30% between 2019 and 2025, from 167.1 square kilometres to 116.3, that Bint Jbeil district lost roughly two-thirds of its farmland since its peak in 2021, and that most of Nabatieh’s decline was concentrated in 2024 alone.
Other data support these findings. The Ministry of Agriculture estimated that 22% of agricultural land was damaged, and FAO data show farmland across Lebanon falling by 3.6% between 2023 and 2024. Together with the United Nations Satellite Center (UNOSAT), FAO recorded negative land-cover change on 13,566 hectares of farmland and 4,957 hectares of forest when comparing October 2024 with a 2019 to 2023 reference.
The South as a lifeline
Vegetation makes up about a third of Lebanon’s area, with forests and shrubland accounting for the largest share at 87.8% and pastures and grassland the remainder. The southern region, especially the districts of Tyre, Bint Jbeil, Marjayoun and Hasbaya, is an ecologically and agriculturally vital area, where communities depend on old-growth olive orchards, fruit trees, tobacco fields and pine as a main source of income, and as a lifeline of economic and social life.
White phosphorus, then bulldozers
The damage took many forms. White phosphorus shells set fires in Dhayra, Bustan, Kfarkela, Mays al-Jabal, Aitaa al-Shaab and Markaba, according to investigations by Amnesty International in October 2023 and Human Rights Watch in June 2024. Remnants of shells that fell on Dhayra showed that they were manufactured in the US states of Louisiana and Arkansas in 1989 and 1992, according to the Washington Post.
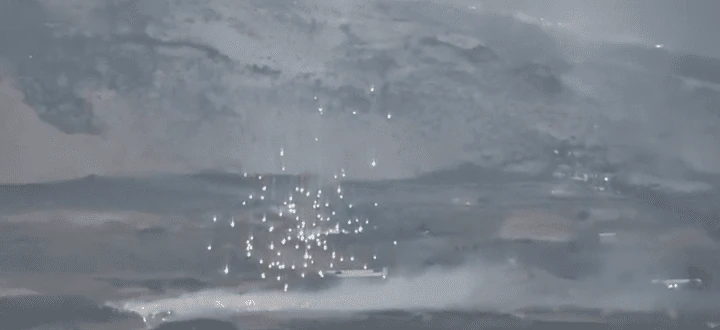
The group Green Southerners documented 195 cases of white phosphorus use across the south. Data from the Ministry of Agriculture and the National Council for Scientific Research, compiled by Legal Agenda in July 2024, point to 841 fires and white phosphorus strikes in the first eight months of the escalation, most of them in Marjayoun district with 116 attacks, then Tyre with 48, Bint Jbeil with 37 and Hasbaya with 11. By early June 2024, 17 million square metres of green space had burned, 55% of it woodland, 35% fruit trees and 10% grassland, and about 60,000 old-growth olive trees were lost. Greenpeace Middle East puts the number of burned olive trees at no fewer than 65,000.
After the ceasefire of 27 November 2024, bulldozers moved in to uproot what trees remained, as happened in the Monks’ Forest in Aitaa al-Shaab, according to Al Jazeera. On 13 March 2025 the group Green Southerners published photos of old-growth olive trees being uprooted in Blida.
Glyphosate in every sample
In February 2026, chemicals were sprayed from the air over border areas. Lebanon’s Ministries of Agriculture and Environment said Israeli military aircraft carried out the spraying. According to Al Jazeera, the UN peacekeeping force UNIFIL was informed of the spraying, and the substance was initially described as “non-toxic”. But the Ministry of Environment and the National Council for Scientific Research collected 36 samples from three villages, Aitaa al-Shaab, Ras Naqoura and Dhayra, 24 of soil and 12 of plants, and detected glyphosate in every sample, at concentrations between 5.8 and 22.8 micrograms per gram, the highest in Aitaa al-Shaab.
The ministry and the council estimated the affected area at about 2,122 hectares across ten villages: 1,163 hectares of field crops, 881 hectares of olives, 41 hectares of citrus, 25 hectares of bananas, 6 hectares of protected agriculture and 5 hectares of fruit trees.
From space: Shqif, Yaroun and Kounine
Lebanese officials and media accuse the Israeli military of using white phosphorus munitions to start huge fires in olive and pine groves near historic landmarks such as Shqif (Beaufort) Castle. On 3 August 2026, the National News Agency confirmed that the Israeli military had carried out extensive operations in the area, as reported by the Sunday Guardian.
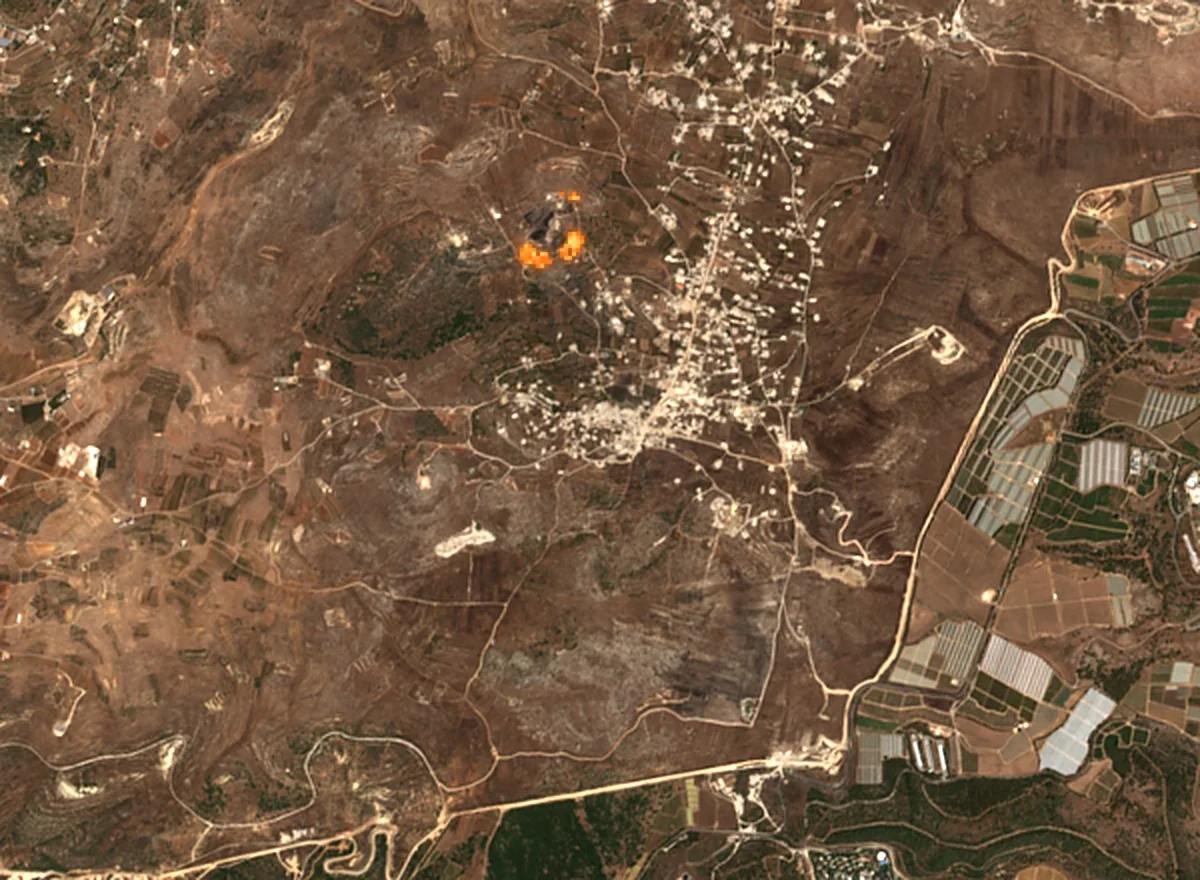
In Bint Jbeil district, videos that we geolocated show old-growth olive orchards being burned in Yaroun. Sentinel‑2 imagery confirms this: on 2 and 4 August 2026 the satellite detected an active fire consuming the oak forest in the Yaroun reserve. The same forest had already been affected by bulldozing in January 2025, between 9 and 19 January according to the imagery, which removed a large part of its tree cover.
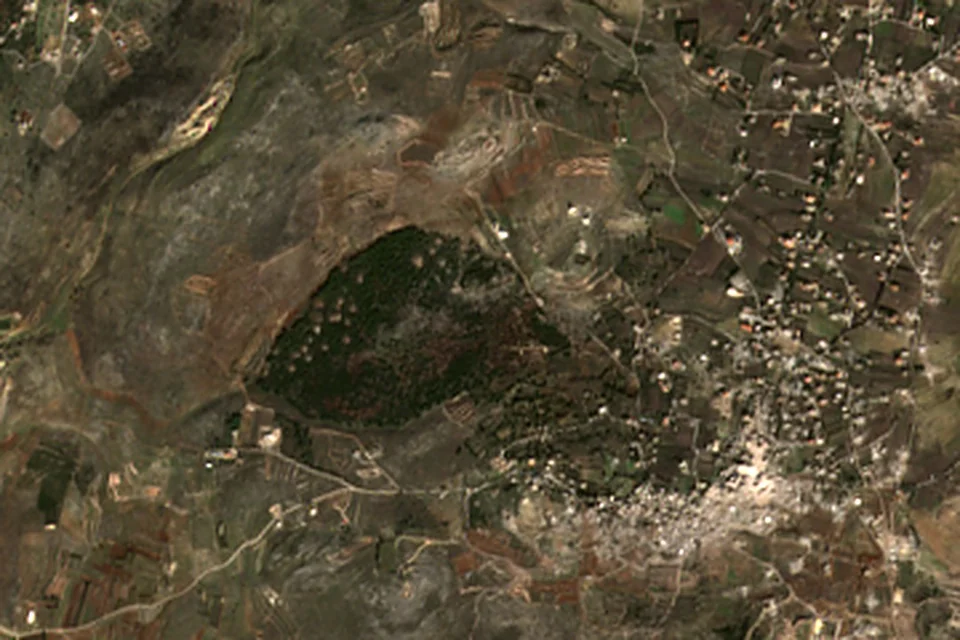
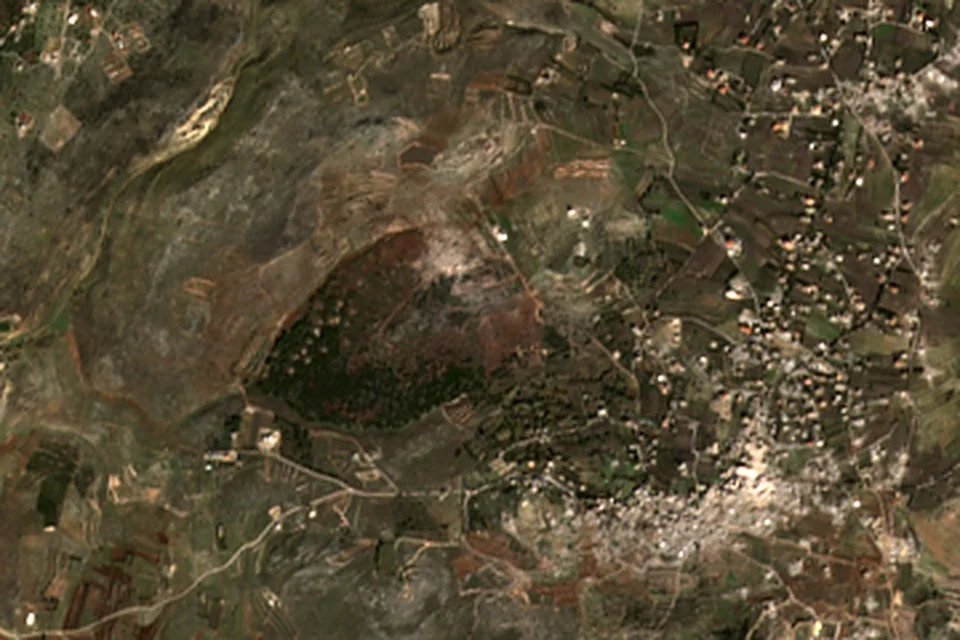
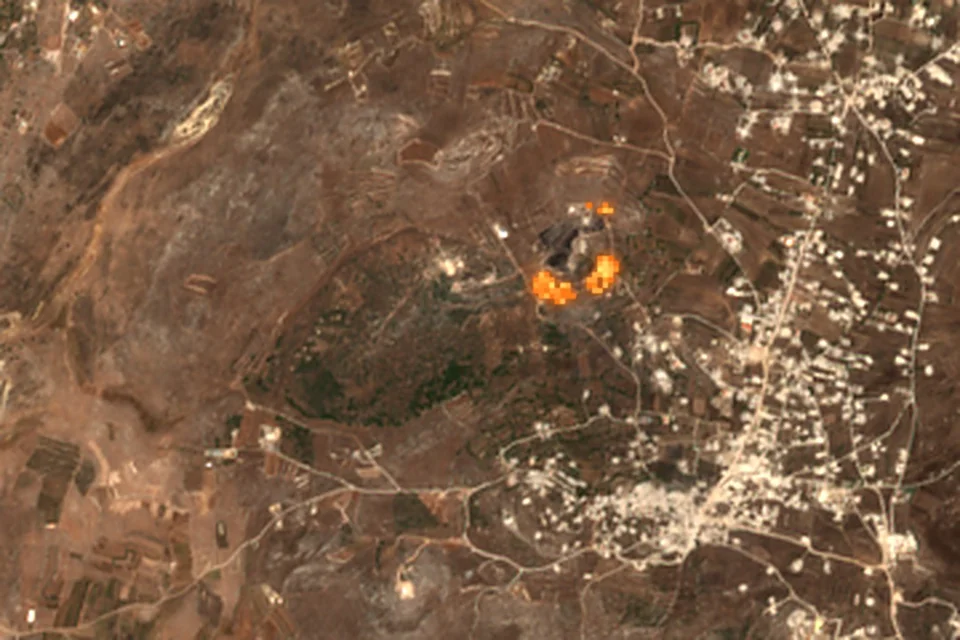
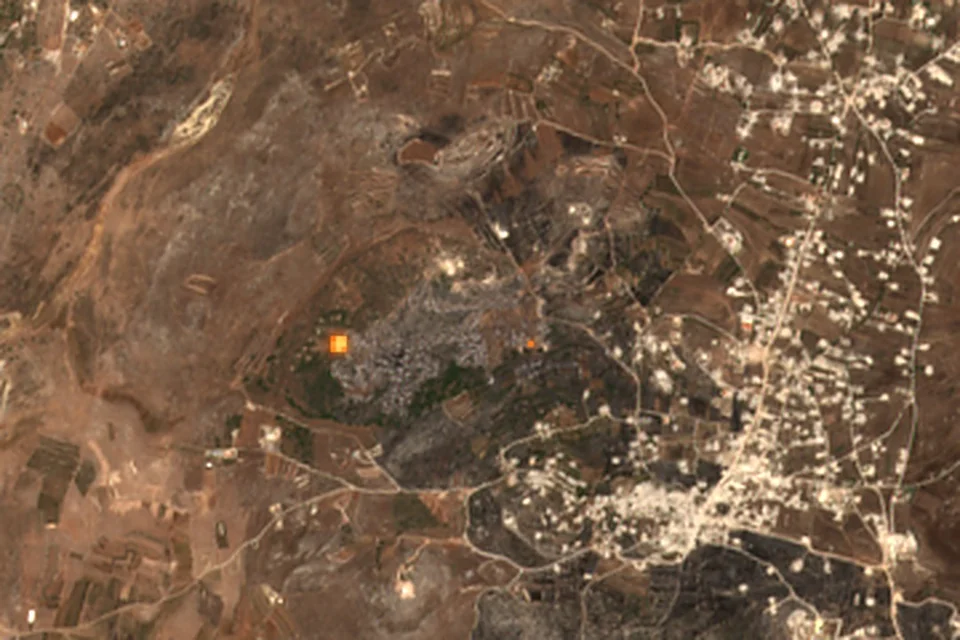
The Yaroun reserve, the oak forest, in four Sentinel‑2 images. The orange hotspots are thermal radiation from active fire, visible in the shortwave infrared bands. Contains modified Copernicus Sentinel‑2 data (2025 and 2026), processed by Pax Memoria.
Explosions the size of earthquakes
In Majdal Zoun, a single explosion split the town in two using more than 80 tonnes of explosives, according to the environment minister. Near Shqif Castle, 700 tonnes of explosives were used in a single blast, according to the minister, citing the National Center for Geophysics. Seismic monitoring stations recorded it at 12:02 a.m. on 31 July 2026 as a tremor of 3.8 on the Richter scale.
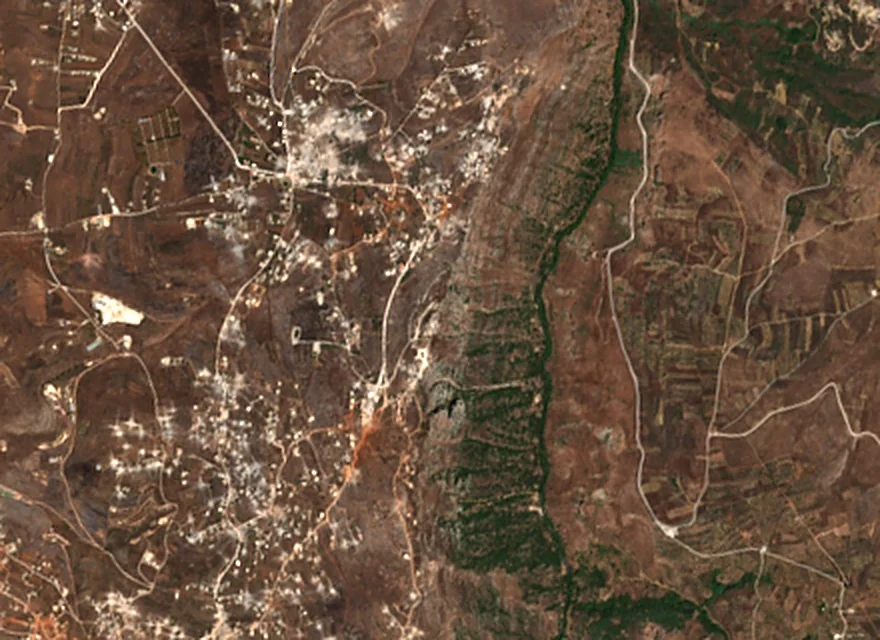
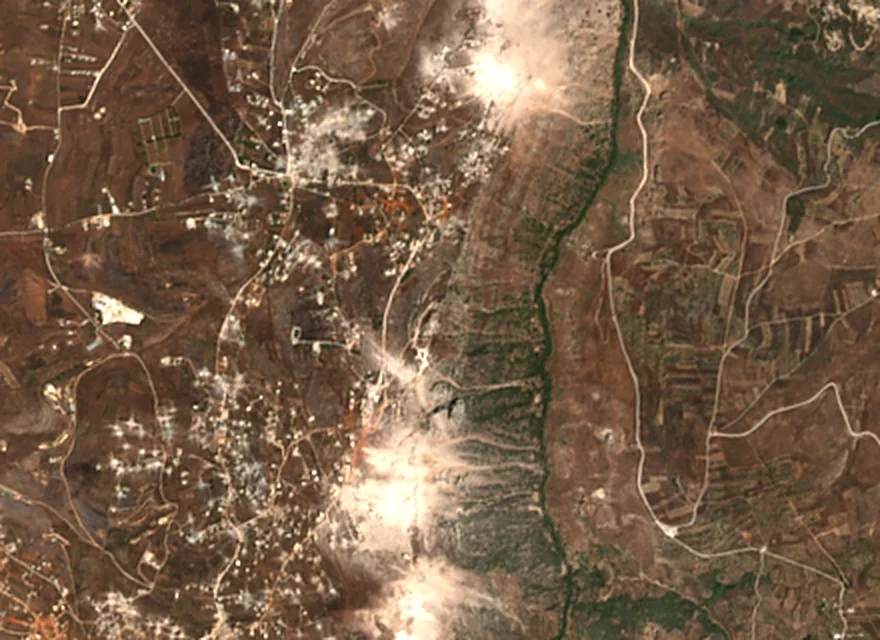
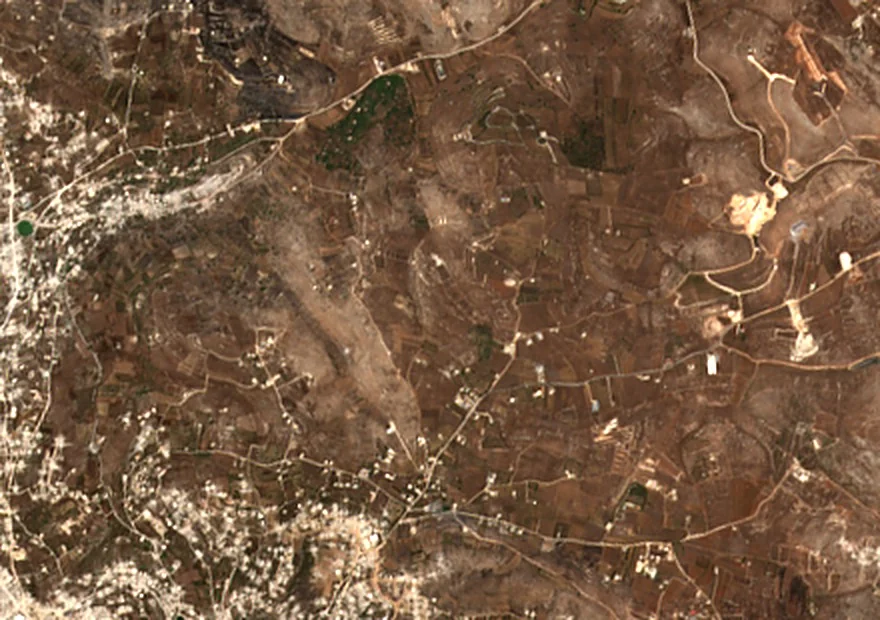
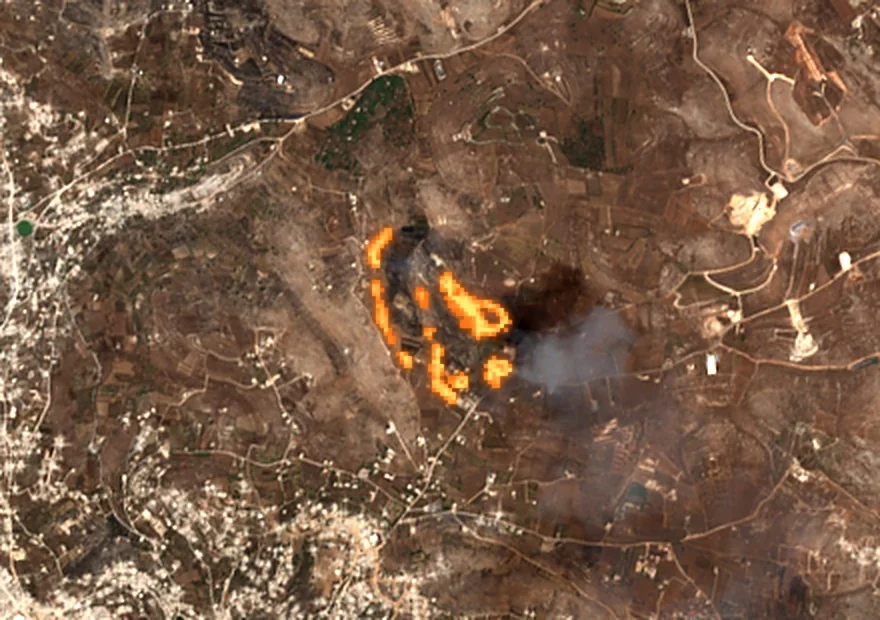
Top: the Shqif Castle area before and after the blast of 31 July 2026. Bottom: the fire that broke out in Kounine between 24 and 27 August 2026, confirmed by clips posted the same day. Contains modified Copernicus Sentinel‑2 data (2026), processed by Pax Memoria.
Beyond the trees
The cost does not stop at the trees. The Food and Agriculture Organization and the Ministry of Agriculture estimated losses to olive orchards at about $247 million, citrus at $107 million and tobacco at $46 million, along with destroyed irrigation networks across more than 1,050 hectares, 23 hectares of greenhouses and about 49,850 beehives, between October 2023 and November 2024. The Ministry of Environment put the cost of environmental damage at more than $440 million, with more than 8,700 hectares of green space lost.
More serious still, the damage reaches the soil itself. According to the United Nations Development Programme, forming a single inch of fertile topsoil can take between 500 and 1,000 years. In samples collected by the National Council for Scientific Research from the south and the Bekaa in July 2025, phosphorus reached 1,858 parts per million, chromium exceeded agricultural safety limits in 45% of samples, and glyphosate was found in both surface and deep layers.
Between April and August 2026, about 1.24 million people in Lebanon, roughly a quarter of the population, faced acute food insecurity, according to the Integrated Food Security Phase Classification.
Methodology of this investigation
Image sources
We relied on three kinds of satellite imagery. The first is SkySat imagery at half-metre resolution and PlanetScope imagery at three-metre resolution, commercial imagery we obtained from its provider and used to analyse vegetation in nine areas. The second is Sentinel‑2 imagery from the European Copernicus programme at ten-metre resolution, which is free, and which we used to analyse farmland and trees between 2017 and 2025 and to detect active fires in Yaroun, Kounine and Shqif. The third is the maps of the National Council for Scientific Research, which we reproduced as published.
Measuring vegetation change
We used the VARI index (Visible Atmospherically Resistant Index), which is calculated from the three visible bands, red, green and blue, and is resistant to atmospheric effects. We chose it because the high-resolution imagery we have does not include the near-infrared band that more common indices such as NDVI require.
We resampled all images onto a single three-metre grid in the UTM Zone 36N coordinate system, then subtracted the index value at the baseline from its value in each later scene. The baseline is the PlanetScope mosaic of 12 September 2024, and for the Kfarchouba frame the mosaic of 24 September 2024. We classified the result into four classes: sharp loss when the index falls by more than 0.1, slight loss when it falls by between 0 and 0.1, slight improvement when it rises by between 0 and 0.1, and strong recovery when it rises by more than 0.1. Areas are calculated from the number of classified pixels multiplied by the area of a pixel.
To calculate the overall total, we merged the eighteen scenes onto a single grid. Where frames overlap, we counted each pixel once, from the last scene that covers it, because two of the scenes were captured over frames that had already been captured, and because the 17 June frame covers about a third of the Ainata frame. This is the reason for the difference between the total (4,452 hectares) and the sum of the table rows.
Revision of 2 October 2026
We published a first version of the technical analysis that included ten areas, 19 scenes and a total of 7,544 hectares. On review, two problems emerged. The first is that the baseline mosaic of 12 September 2024 does not cover the city of Tyre frame, nor the eastern half of the Kfarchouba frame, and the uncovered area had been filled with a white colour that carries no “no data” value, so the loss shares there (38.6% and 19.7%) came out invalid. The second is that the total added up all 19 scenes, counting the same land twice where frames overlap. We addressed the first by recalculating Kfarchouba against the 24 September 2024 mosaic, which covers the whole frame, and by excluding the city of Tyre because no baseline image exists for it. We addressed the second by merging at the pixel level. Full details for each frame are in Technical Appendix I below.
Farmland and trees, 2017 to 2025
This analysis relied on Sentinel‑2 imagery at ten-metre resolution for the South and Nabatieh governorates. We classified land cover each year into trees, farmland and other classes, then compared areas at governorate and district level. Details, and the test of how robust the signal is, are in Technical Appendix II below.
Detecting active fires
In Sentinel‑2 imagery, active fire appears as bright orange patches when the shortwave infrared bands are combined with the visible bands, because the heat of the flames radiates strongly in those bands. We used this composite to date the fires in Yaroun (2 and 4 August 2026) and Kounine (27 August 2026), and to detect the dust clouds after the Shqif blast (2 August 2026). This method does not detect small fires or those that went out before the satellite passed over, so it confirms that fire was present but does not rule out its presence on other dates.
Verifying the videos
We located the videos of the burning of the Yaroun orchards by matching the landmarks visible in them, such as roads, orchard lines and buildings, against satellite imagery of the same area. We do not attribute any video to a place or date except after this matching. Material we could not verify ourselves is attributed to its publisher.
Verifying the figures
We compared every figure, date and place name in this text with its original source, and we cite the source next to each figure. Where sources differ, we state the difference, as with the number of burned olive trees (60,000 according to Legal Agenda and at least 65,000 according to Greenpeace). We attributed the figure of 700 tonnes of explosives to the environment minister, and we did not find an official Israeli military statement that confirms it. We also attributed the National News Agency’s confirmation on 3 August 2026 to the Sunday Guardian, which reported it, because we did not find the text of the original statement.
Limits of the analysis
- The VARI index measures greenness, not its cause. A decline may be due to fire, bulldozing, seasonal drought or harvest. For this reason we compared the index results with fire maps and videos, and did not rely on it alone to attribute damage to a particular cause.
- The baseline is from September 2024, the end of summer, when greenness is at its lowest. Spring scenes may show seasonal improvement, and summer scenes compare like season with like season. For this reason we relied on the last scene for each frame when merging.
- We tested the sensitivity of the results to the choice of baseline by recalculating all scenes against the 24 September 2024 mosaic. The share of sharp loss rose by about three percentage points on average, and the ranking of the areas stayed the same.
- The areas given represent only the frames we analysed, not the whole south. The figure of 4,452 hectares is a minimum of what can be measured in these frames, not an estimate of total loss.
Scope of this investigation
This investigation documents physical damage to vegetation and farmland. It does not assess intent or legal responsibility, which would require a separate legal analysis.
Technical Appendix I: ΔVARI analysis, area by area
This appendix and the one that follows contain the two technical reports prepared by Pax Memoria in September 2026: the first on vegetation change measured with the ΔVARI index in high-resolution imagery, the second on the series of trees and farmland between 2017 and 2025, with their figures, maps and methodology. The ΔVARI figures are shown in their corrected form following the revision of 2 October 2026.
Detail table: the four classes in each frame
For each frame, the table shows the area analysed and its distribution across the four classes: sharp loss (index falls by more than 0.1), slight loss (falls by between 0 and 0.1), slight improvement (rises by between 0 and 0.1) and strong recovery (rises by more than 0.1). The four classes add up to the area analysed in each scene. Maximum drop is the lowest ΔVARI value recorded for a single pixel in the scene. The baseline is 12 September 2024 except where stated otherwise.
| Frame | Scene date | Area analysed | Sharp loss | Slight loss | Slight improvement | Strong recovery | Maximum drop | Share of sharp loss |
|---|---|---|---|---|---|---|---|---|
| Shamaa · Majdal Zoun · Tayr Debba Tyre district, eastern side | 22 July 2026 | 1,716 | 1,228 | 438 | 40 | 9 | −38.06 | 71.6% |
| Yaroun · Ainata · Rmeish · Srifa · Hanine Bint Jbeil district | 17 June 2026 | 2,673 | 1,779 | 775 | 85 | 34 | −12.91 | 66.5% |
| Dhayra · Mansouri Tyre district, western side | 3 June 2026 | 714 | 368 | 234 | 72 | 40 | −19.60 | 51.6% |
| Ainata · Yaroun · Blida · Aitaroun Bint Jbeil district | 17 March 2026 | 1,912 | 462 | — | — | — | — | 24.2% |
| Kfarchouba · Khirbet Selm · Debaal Marjayoun district · Baseline: 24 September 2024 | 17 July 2026 | 5,042 | 290 | — | — | — | — | 5.8% |
| Sarafand · Zrariyeh · Kfarsir Sidon district | 23 May 2026 | 1,792 | 105 | 804 | 680 | 202 | −33.88 | 5.8% |
| Ghazieh · Bourj Rahhal Sidon district | 4 March 2025 | 1,288 | 58 | 370 | 542 | 317 | −1.82 | 4.5% |
| Tebnine · Deir Mimas Bint Jbeil district | 28 March 2026 | 1,721 | 57 | 146 | 394 | 1,124 | −11.87 | 3.3% |
| Nabatieh al-Tahta · Arnoun Nabatieh district | 7 May 2026 | 674 | 13 | 127 | 200 | 334 | −3.16 | 1.9% |
Areas in hectares. For the Ainata and Kfarchouba frames, only the sharp loss and its share were published from the recalculation, so the remaining cells are left empty.
Maps of the remaining frames
The maps for the Shamaa and Yaroun frames are shown in the main text above. Below are the maps of five other frames. In each pair, the first map shows the ΔVARI value on a gradient from red (decline) to green (improvement), and the second shows the classification into the four classes.
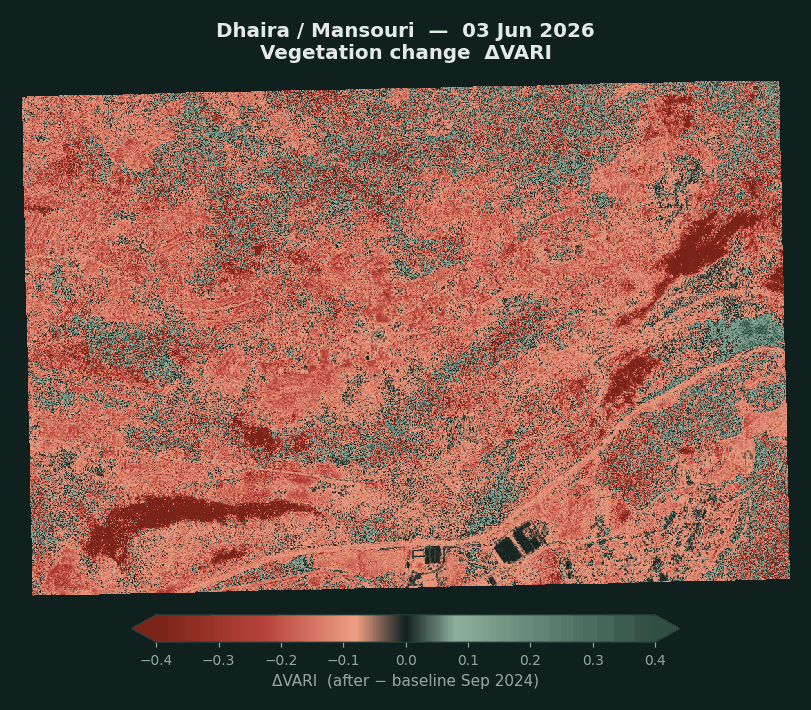
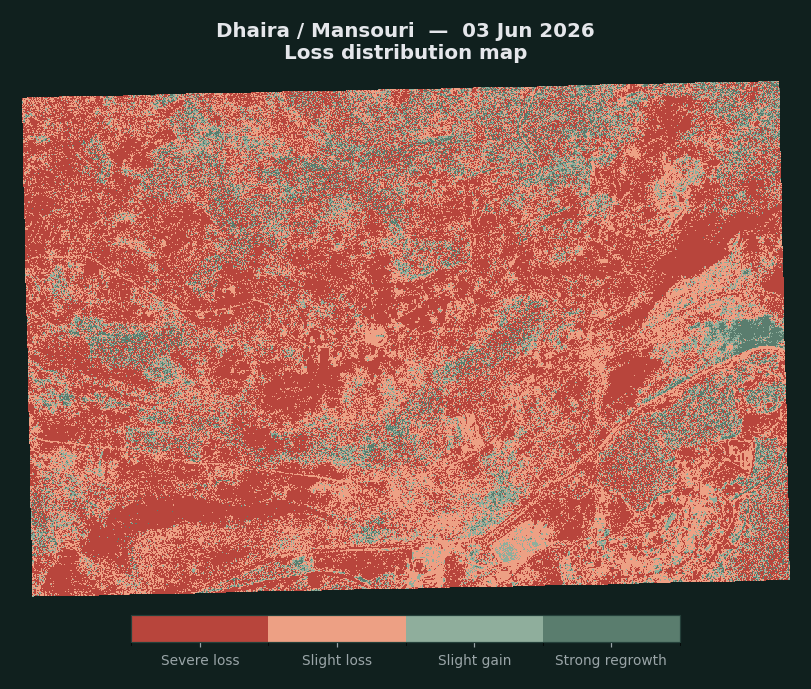
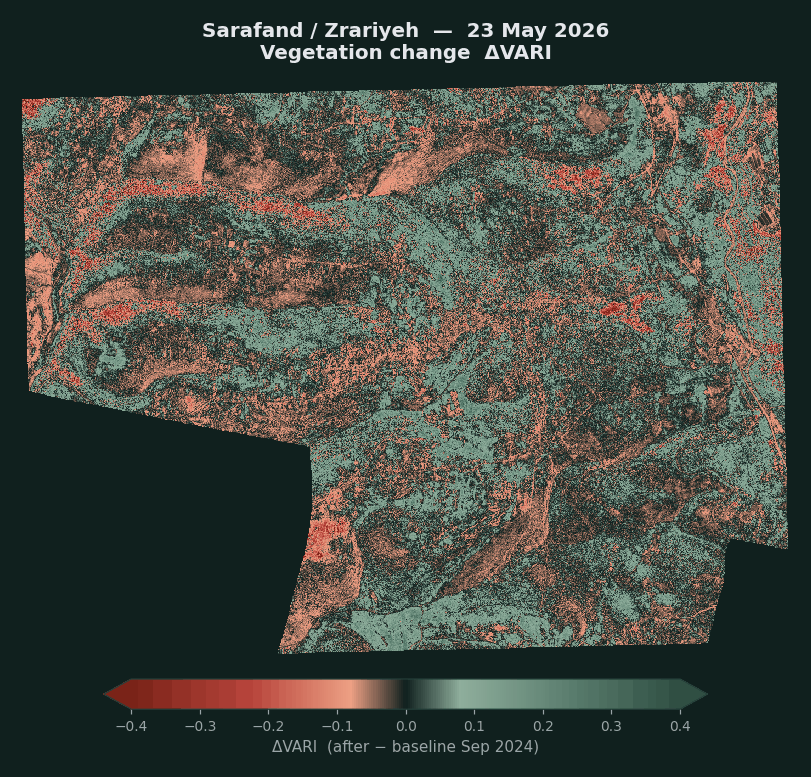
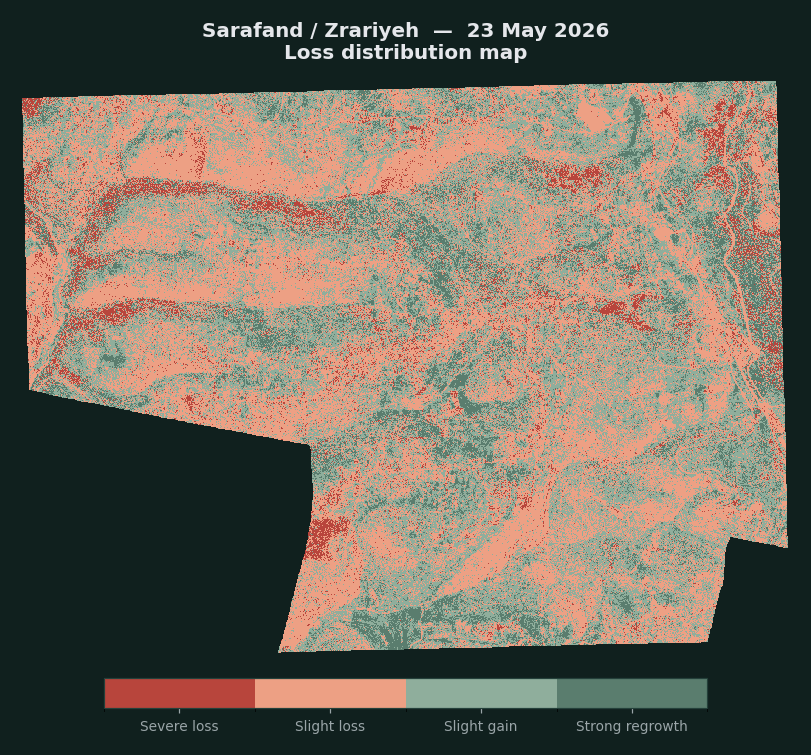
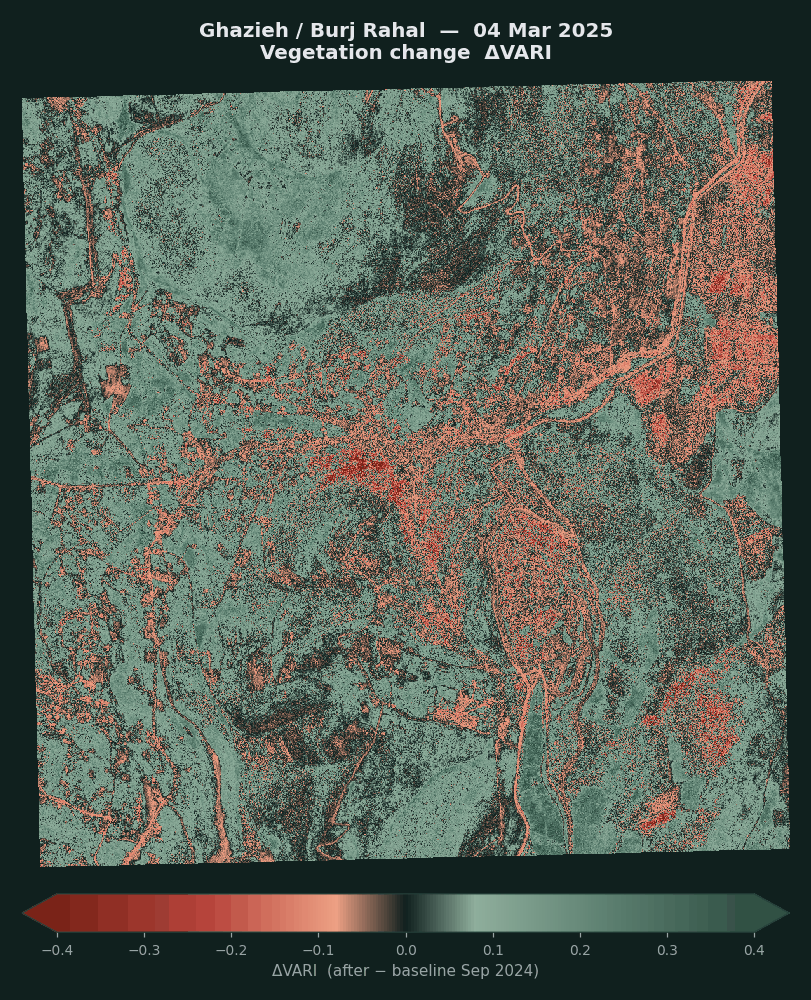
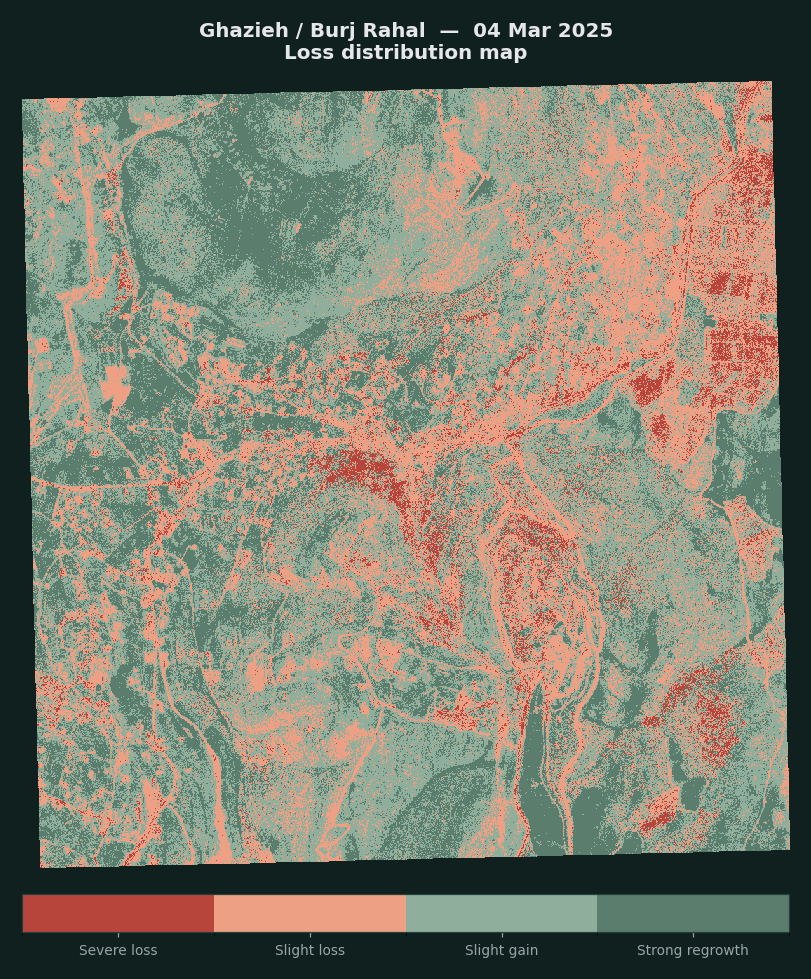
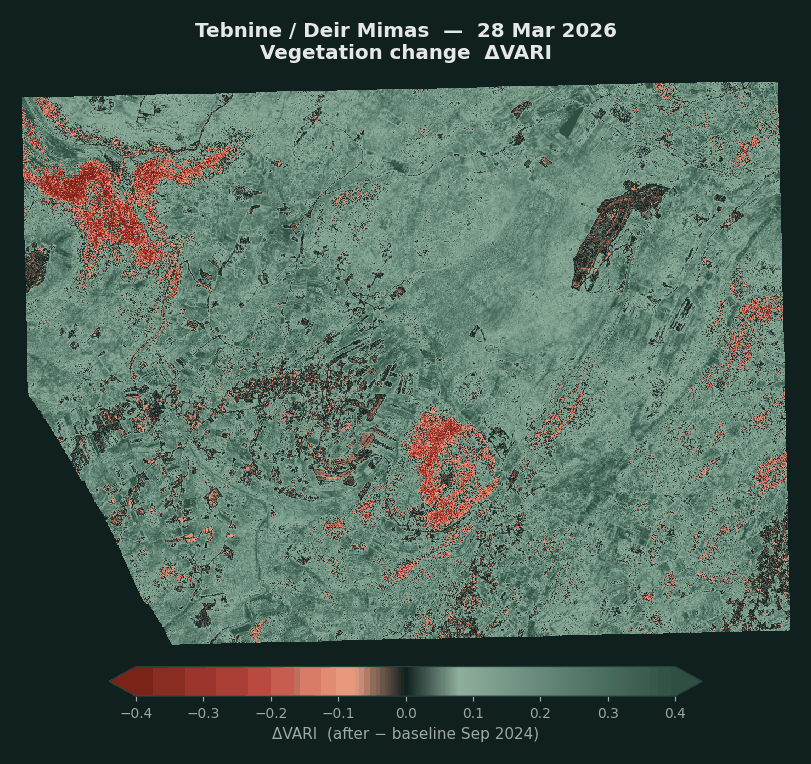
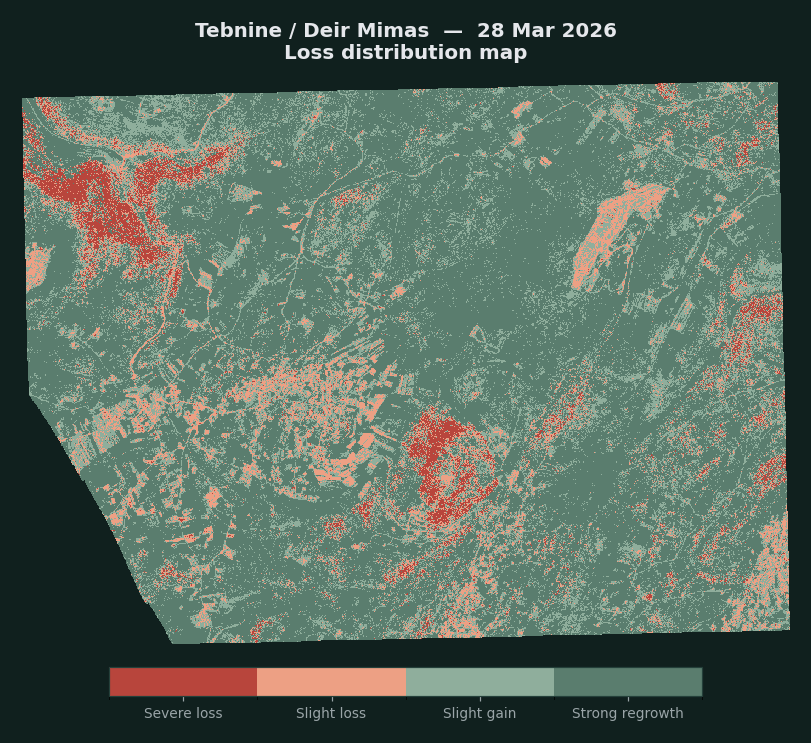
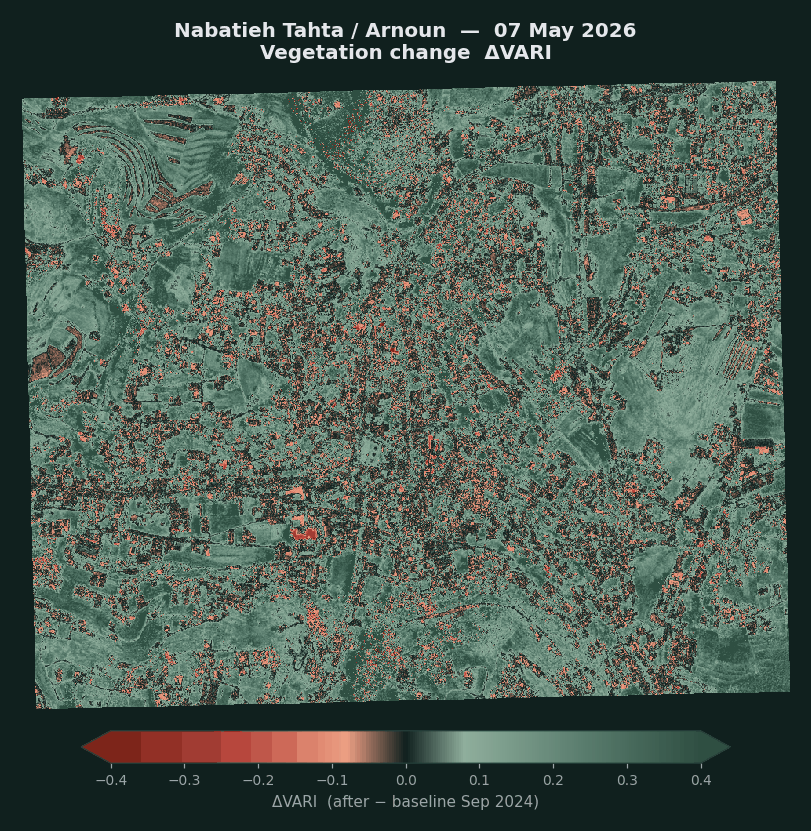
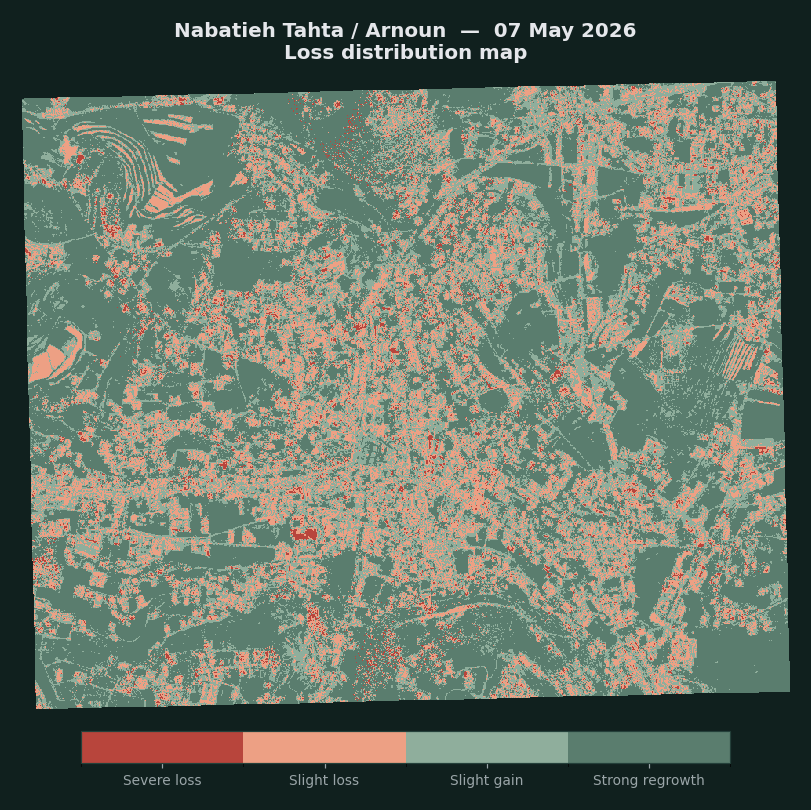
ΔVARI = the index value in the scene minus its value in the September 2024 baseline. Areas are calculated from the number of classified pixels multiplied by the area of a pixel, and represent the area actually analysed after excluding pixels with no data. 1 square kilometre = 100 hectares.
Technical Appendix II: Trees and farmland, 2017 to 2025
A full annual series covering nine consecutive years for the South and Nabatieh governorates, which makes it possible to separate the real trend from classification noise, rather than settling for comparing two years. The study area is 2,043 square kilometres, at ten-metre resolution, across 324 pixel-level queries, at the level of the two governorates and seven districts.
Why the full series
Comparing only two years does not allow us to tell real change from noise in the classification, but measuring this over a longer period of nine consecutive years does. We can measure the size of the natural fluctuation numerically and then test every claim against it, instead of merely warning about it. That is what we did here. As a result, some of what looked like “change” in the two-year comparison did not hold up, and some of it held up and was strengthened. Details are in the robustness test paragraph below.
The layer does not yet include 2026. The last published year is 2025, since each annual layer is issued in the year after it, so the 2026 layer is expected in mid-2027.
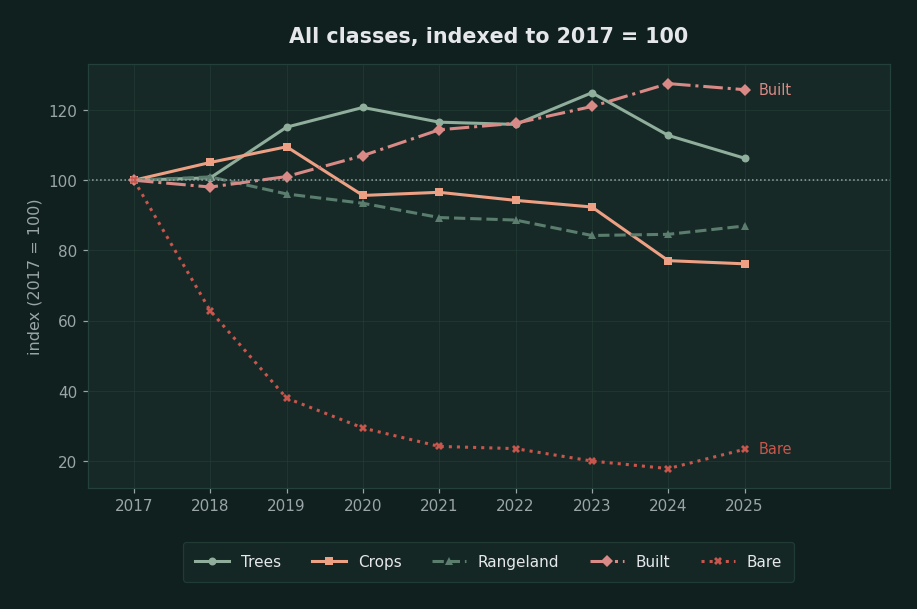
Farmland is the clearest and most robust signal in the data. It peaked at 167.1 square kilometres in 2019 and fell to 116.3 in 2025, a drop of 30.4%, with a decline in six of the eight annual periods. This is a sustained trend, not an isolated event.
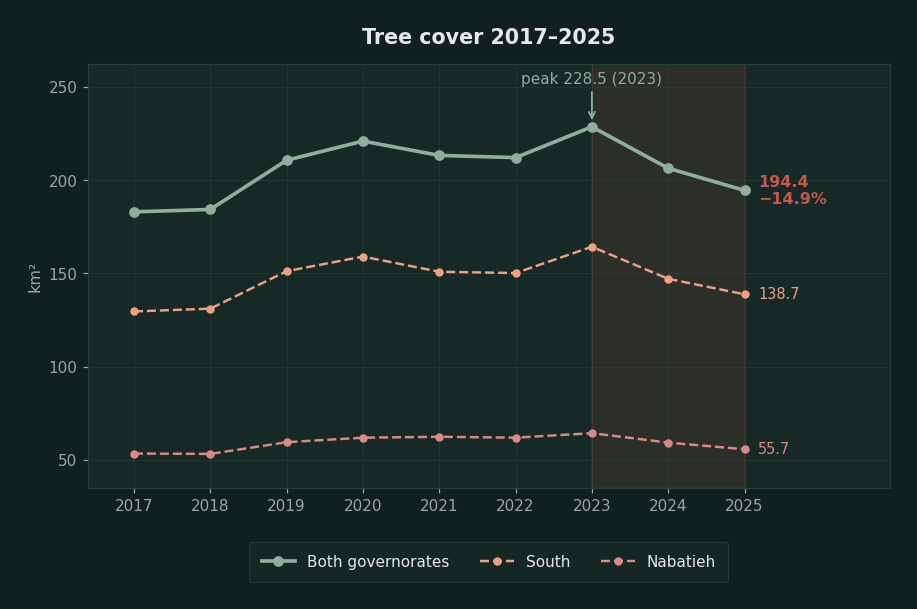
Tree cover tells a different story and must be read carefully. It rose from 182.9 square kilometres in 2017 to a peak of 228.5 in 2023, then fell for two consecutive years to 194.4 in 2025. The decline is real and notable, but it is a decline from a peak: the 2025 level is still higher than the levels of 2017 and 2018 (183 to 184 square kilometres).
Urban expansion is the largest and most consistent change: +167.5 square kilometres over nine years (+25.8%), rising in seven of the eight periods. In size it exceeds everything lost in trees and farmland combined.
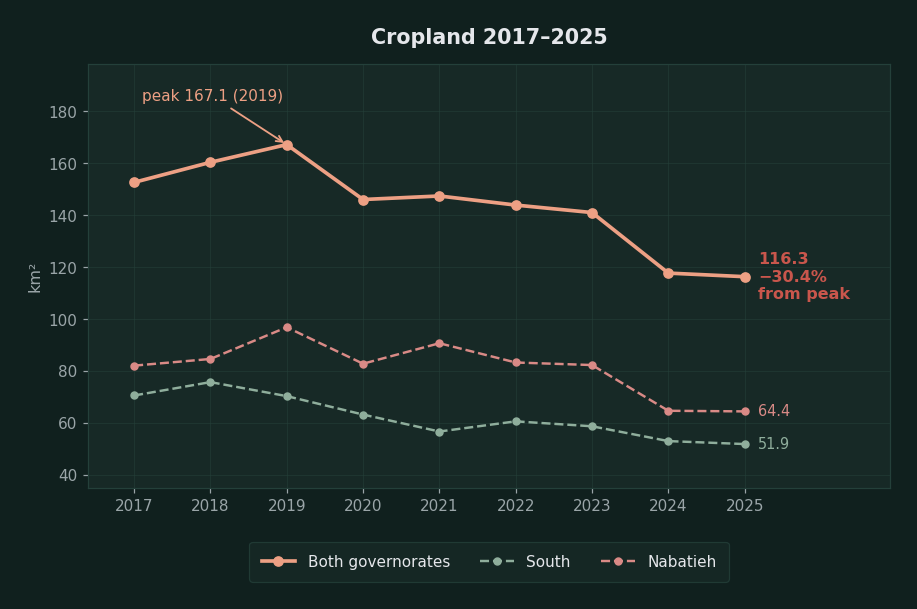
The decline has continued since 2019 and covers both governorates, but at two different paces. In the South the decline started early, from 70.5 square kilometres in 2017 to 51.9 in 2025 (−26.5%). In Nabatieh the area stayed stable at around 82 to 97 square kilometres until 2023, then dropped sharply to 64.7 in 2024 and held there, so most of the loss was concentrated in a single year.
Robustness test: what held up and what did not
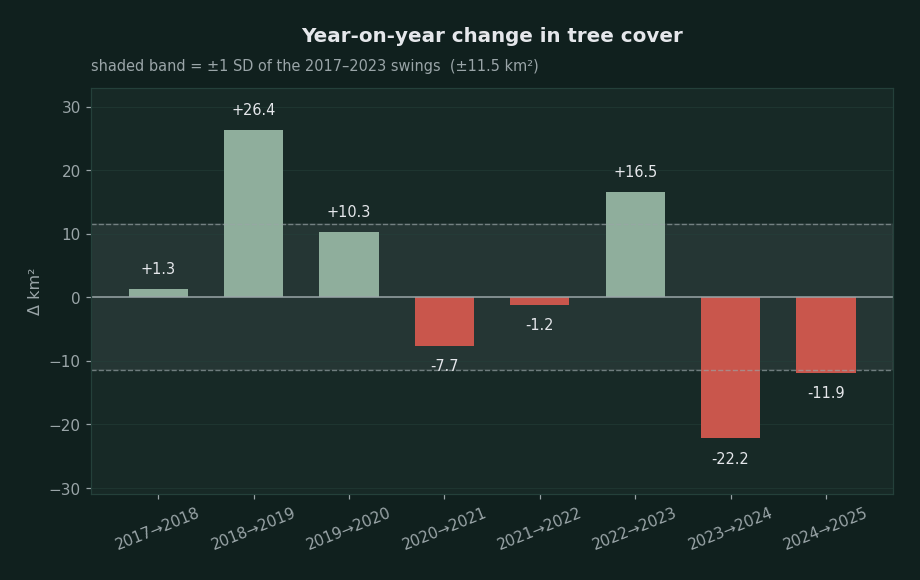
The size of natural fluctuation in tree cover during 2017 to 2023 was ±11.5 square kilometres a year (standard deviation). The 2024 to 2025 decline taken alone (−11.9 square kilometres) therefore sits exactly at the limit of the fluctuation, and cannot be considered evidence by itself.
What makes the signal meaningful is something else: 2023 to 2024 and 2024 to 2025 are the only two consecutive declines in the whole record, and their sum of −34.1 square kilometres exceeds the fluctuation by almost three times, and appears in both governorates, which were analysed independently.
What did not hold up. The bare ground class shows a fall from 15.85 square kilometres in 2017 to 3.71 in 2025, or −77%. This is not a real change on the ground but a drift in the classification model itself across the years of the series. We therefore excluded this class from any conclusion, and any small figure in this appendix should be read with the same caution.
In the earlier report we pointed to a 1.4% decline in “built-up areas” between 2024 and 2025 as evidence of noise. The full series confirms this and puts it in proportion: built-up area rose in seven of the eight periods by a total of +167.5 square kilometres, and the only decline (−11.3 square kilometres in 2024 to 2025) is the anomaly. The size of the noise in this product is about ±11 square kilometres, and it is the yardstick against which we measured everything above.
The second level: the most affected districts
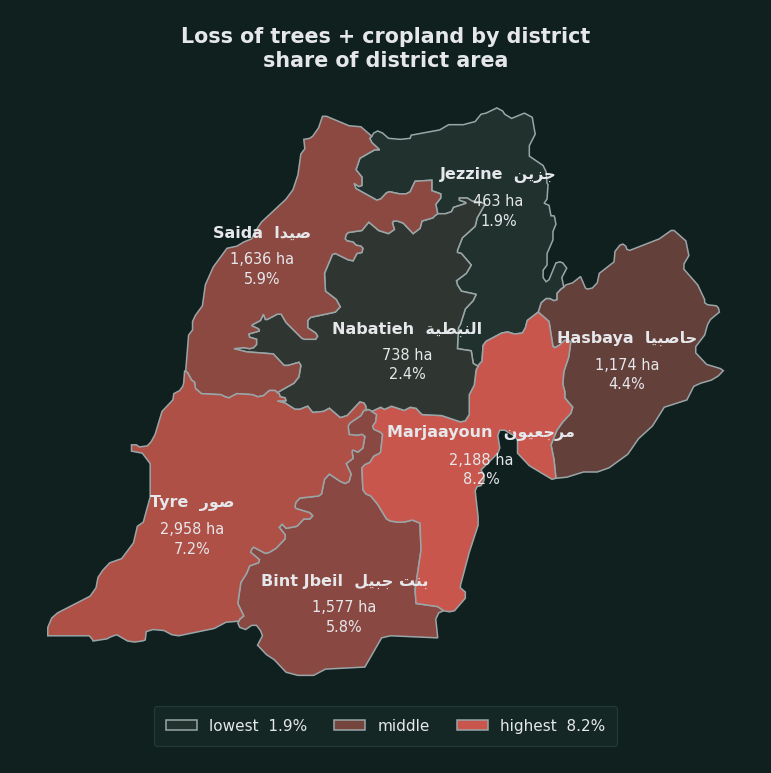
Until now the analysis has been at governorate level. Breaking the two governorates into seven districts shows that the loss is not evenly distributed: three districts account for 62% of the total loss, and one district has lost practically nothing. The measure here is the difference between each class’s peak in each district and its value in 2025, not the difference between two years. The peak for trees in Tyre was 2023, while its peak for farmland was 2018, and merging the two dates into one “period” would have hidden half the change.
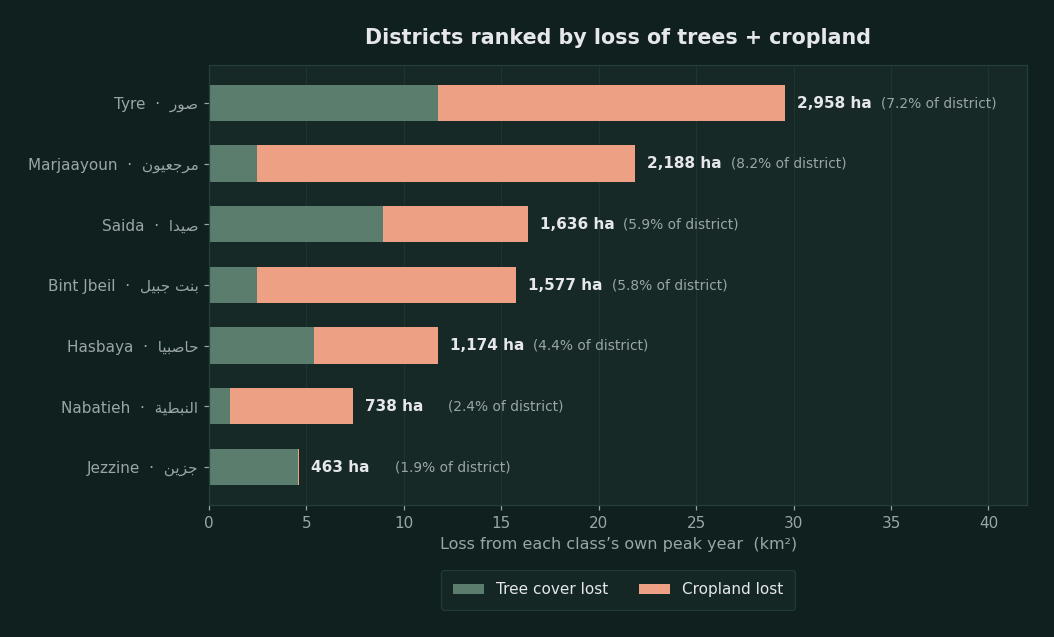
| District | Governorate | Trees: peak (km²) | Trees 2025 | Change | Farmland: peak (km²) | Farmland 2025 | Change | Total loss | Of district area |
|---|---|---|---|---|---|---|---|---|---|
| Tyre | South | 53.9 (2023) | 42.1 | −21.8% | 44.0 (2018) | 26.2 | −40.5% | 2,958 ha | 7.2% |
| Marjayoun | Nabatieh | 14.1 (2023) | 11.6 | −17.6% | 55.3 (2019) | 35.9 | −35.1% | 2,188 ha | 8.2% |
| Sidon | South | 22.8 (2020) | 13.9 | −39.1% | 22.8 (2018) | 15.3 | −32.7% | 1,636 ha | 5.9% |
| Bint Jbeil | Nabatieh | 11.2 (2023) | 8.8 | −22.1% | 20.1 (2021) | 6.8 | −66.0% | 1,577 ha | 5.8% |
| Hasbaya | Nabatieh | 23.5 (2022) | 18.1 | −22.9% | 27.2 (2019) | 20.9 | −23.4% | 1,174 ha | 4.4% |
| Nabatieh | Nabatieh | 21.6 (2023) | 20.6 | −5.0% | 13.0 (2019) | 6.7 | −48.5% | 738 ha | 2.4% |
| Jezzine | South | 81.4 (2023) | 76.9 | −5.6% | 2.5 (2022) | 2.4 | −3.6% | 463 ha | 1.9% |
Areas in square kilometres, with the peak year in brackets. Total loss in hectares is the sum of what was lost of trees and farmland from each class’s peak to 2025, and the last percentage relates it to the district’s area. District boundaries are from geoBoundaries ADM2.
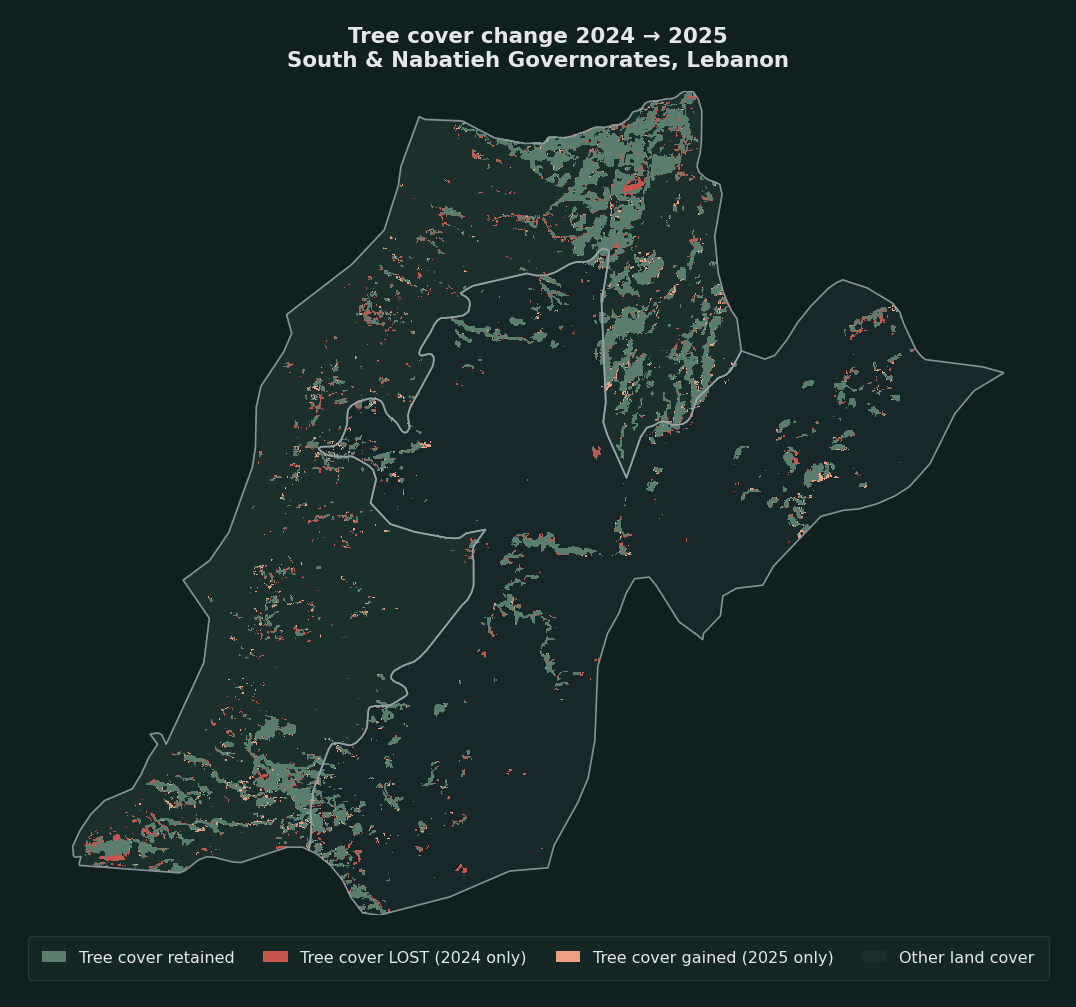
What the map says. The first four districts, Tyre, Marjayoun, Bint Jbeil and Hasbaya, form a continuous strip along the southern border and the southern coast. Jezzine, the only district far from this strip and the most heavily forested (76.9 square kilometres of trees, more than a third of the two governorates’ forests), kept its cover almost intact (−5.6% trees and −3.6% farmland). This geographic contrast is the strongest finding at this level of analysis, because it cannot be explained by a drift in the classification model: the same model was applied to all districts in the same year.
The dominant pattern points to greater agricultural loss than forest loss. In five of the seven districts, farmland loss was greater than tree loss, by a wide margin in Bint Jbeil (−66.0%) and Nabatieh (−48.5%) and Marjayoun (−19.4 square kilometres). Sidon is the exception where the two declines come close to each other, and Jezzine is the exact opposite exception.
A caution on reading. District figures are noisier than governorate figures, because the areas are smaller and the absolute values of each class are correspondingly smaller. When the size of fluctuation at the level of the two governorates is ±11.5 square kilometres a year, the whole class in a district like Jezzine (2.4 square kilometres of farmland) is smaller than that fluctuation itself. Small percentages in this table, roughly below 10%, should therefore not be read as confirmed change. What holds up is the large and consistent figures: Tyre, Marjayoun and Bint Jbeil, where the loss runs to thousands of hectares and appears as a continuous decline across several years, not as a jump in a single year. The sum of the seven districts (2,035 square kilometres) matches the sum of the two governorates (2,043 square kilometres) to within 0.4%, a cross-check that the partition is sound.
Full series table
| Class (km²) | 2017 | 2018 | 2019 | 2020 | 2021 | 2022 | 2023 | 2024 | 2025 | Change from peak |
|---|---|---|---|---|---|---|---|---|---|---|
| Trees | 182.9 | 184.2 | 210.6 | 220.9 | 213.2 | 212.0 | 228.5 | 206.3 | 194.4 | −14.9% |
| Farmland | 152.6 | 160.3 | 167.1 | 146.0 | 147.3 | 143.8 | 141.0 | 117.7 | 116.3 | −30.4% |
| Grassland and shrubland | 999.8 | 1,009.2 | 960.7 | 934.1 | 893.6 | 886.5 | 842.5 | 845.9 | 869.6 | −13.8% |
| Built-up areas | 649.9 | 637.3 | 656.7 | 695.5 | 743.2 | 755.2 | 786.3 | 828.7 | 817.4 | +25.8% |
| Bare ground unreliable | 15.9 | 10.0 | 6.0 | 4.7 | 3.8 | 3.7 | 3.2 | 2.8 | 3.7 | −77% |
| Water | 42.3 | 42.4 | 42.3 | 42.2 | 42.1 | 42.1 | 41.9 | 42.1 | 42.0 | −0.8% |
Areas in square kilometres within the administrative boundaries of the South and Nabatieh governorates. The change in the last column is calculated from each class’s peak to 2025, except for built-up areas, which is from 2017 to 2025.
Methodology of this appendix
The source is the Sentinel‑2 10m Land Use/Land Cover layer from Esri Living Atlas, a global annual classification at ten-metre resolution. We ran 324 histogram queries (nine years × two governorates × 18 tiles) at native pixel level within the administrative boundaries of each governorate.
The service works only in the Web Mercator projection, which inflates areas by a factor of 1/cos²(latitude). We therefore corrected each tile by the latitude of its centre, then checked the correction by matching the resulting area (2,043 square kilometres) against the known administrative area of the two governorates. Without this correction the figures would have come out about 45% higher.
The governorate boundaries are from Natural Earth (admin‑1) and are generalised, so the area analysed may differ slightly from the official area. District boundaries are from geoBoundaries ADM2. All years were analysed in the same way and with the same boundaries, so comparison between them is internally consistent.
Core references
- National Council for Scientific Research: map of the intensity of fires that broke out as a result of Israeli attacks on south Lebanon (8,556, 160 and 1,914 hectares)
- National Council for Scientific Research: Post-War Recovery Report, April 2026 (olives, citrus and forests, economic losses, soil samples)
- National Council for Scientific Research: report on the Israeli offensive against Lebanon, 2023 to 2024
- World Bank: Lebanon Rapid Damage and Needs Assessment, November 2024
- Ministry of Public Health: tally of the dead and wounded as of 25 September 2026
- Fire journal: fire trends in Lebanon, 2001 to 2020
- Nawa Media: fire trends dashboard, 2001 to 2026
- Ministry of Agriculture: second weekly response report
- Food and Agriculture Organization and UNOSAT: vegetation assessment in south Lebanon
- Amnesty International: evidence of Israel’s unlawful use of white phosphorus in southern Lebanon, October 2023
- Human Rights Watch: Israel’s use of white phosphorus risks civilian harm, June 2024
- Washington Post: investigation into the Dhayra shells and Truthout
- Legal Agenda: the white phosphorus attack, July 2024
- Greenpeace Middle East: Annihilating South Lebanon
- Al Jazeera: the Monks’ Forest in Aitaa al-Shaab, 23 December 2025
- Al Jazeera: chemical spraying in south Lebanon, 4 February 2026
- Ministry of Environment: glyphosate sample test results
- Environment minister: the Majdal Zoun blast and the Shqif blast
- Sunday Guardian: Yaroun, Arnoun and Shqif, 3 August 2026
- Lebeconomy: the environment minister estimates environmental damage at $440 million
- Environmental Justice Atlas: white phosphorus in south Lebanon, and the UNDP report on soil
- Integrated Food Security Phase Classification: acute food insecurity in Lebanon, November 2025 to August 2026
- Pax Memoria: technical report on the ΔVARI analysis and report on trees and farmland 2017 to 2025, September 2026, both included in full in the two technical appendices of this investigation
- Pax Memoria: the film “South Lebanon’s Fires: How Did the Environment Become a Target?” (YouTube)